 Opti'
Opti'What the add-in does
For many monitoring and evaluation teams, Excel is still the spreadsheet of reference: it is where KoboToolbox exports land, where partner datasets arrive, and where donor tables are built. Rather than asking teams to switch tools, the add-in brings Opti's analysis into Excel.
- It works directly on the dataset already open.
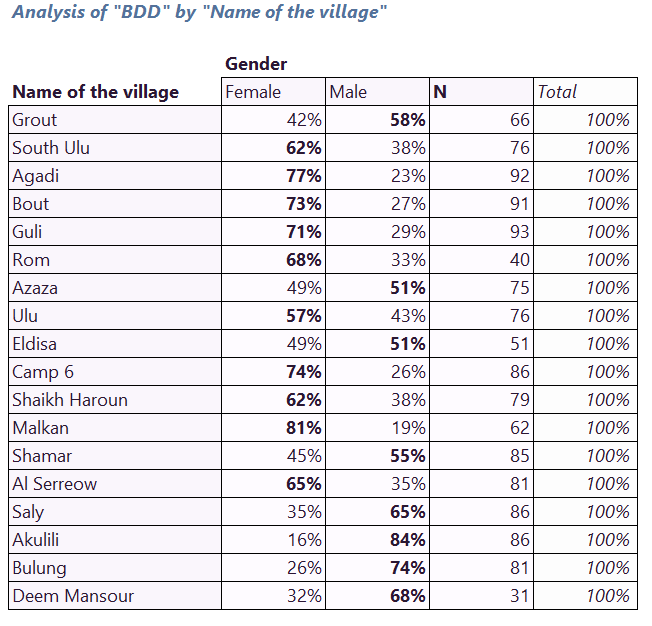
- It builds cross-tabulations without any manual pivot table work.
- It writes an interpretation of each table, which the analyst reviews and completes.
- It speeds up the production of reports and feedback sessions.
It analyses any structured Excel dataset: an export from KoboToolbox or ODK, a dataset produced by Opti Gemba, or a file received from a partner.
Installing it
- In Excel, open the Insert menu, then Office Add-ins.
- Search for Opti' and add the add-in. You can also go through its page on Microsoft AppSource.
- The add-in appears in the Excel ribbon. Open your dataset and run an analysis.
Three analysis modes
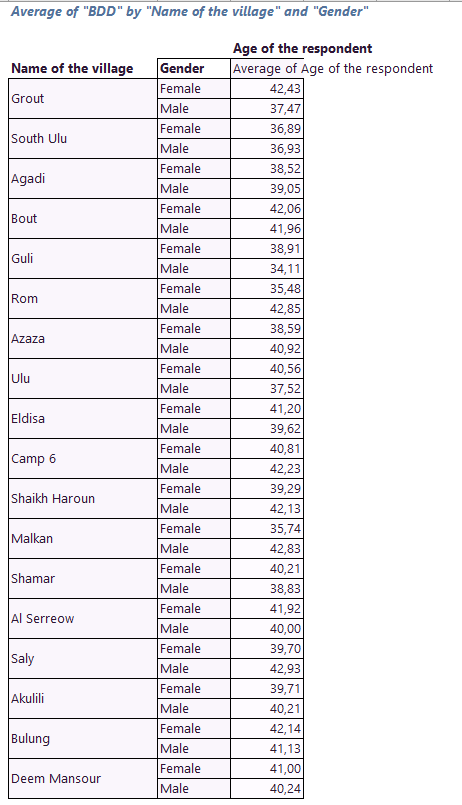
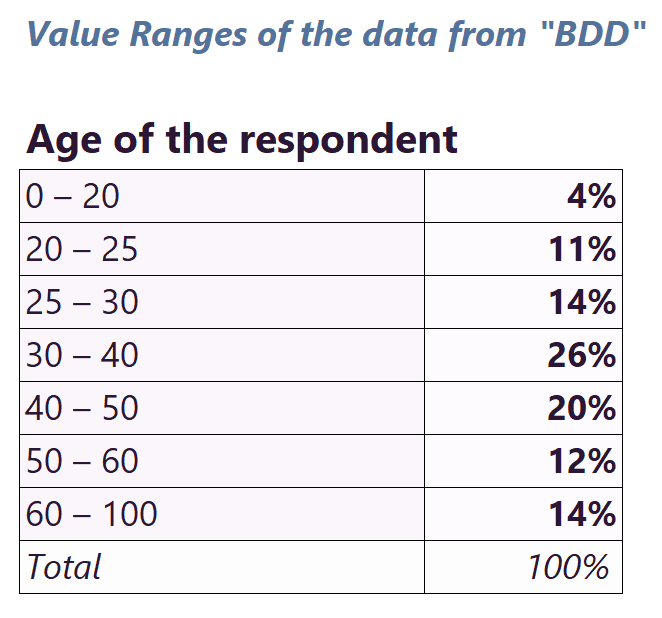
Each mode can be crossed with one or two disaggregation columns, for example location and respondent's sex.
AI interpretations
The figures are produced by Excel, with formulas you can inspect. AI comes in afterwards, for what it is good at: reading the tables and writing.
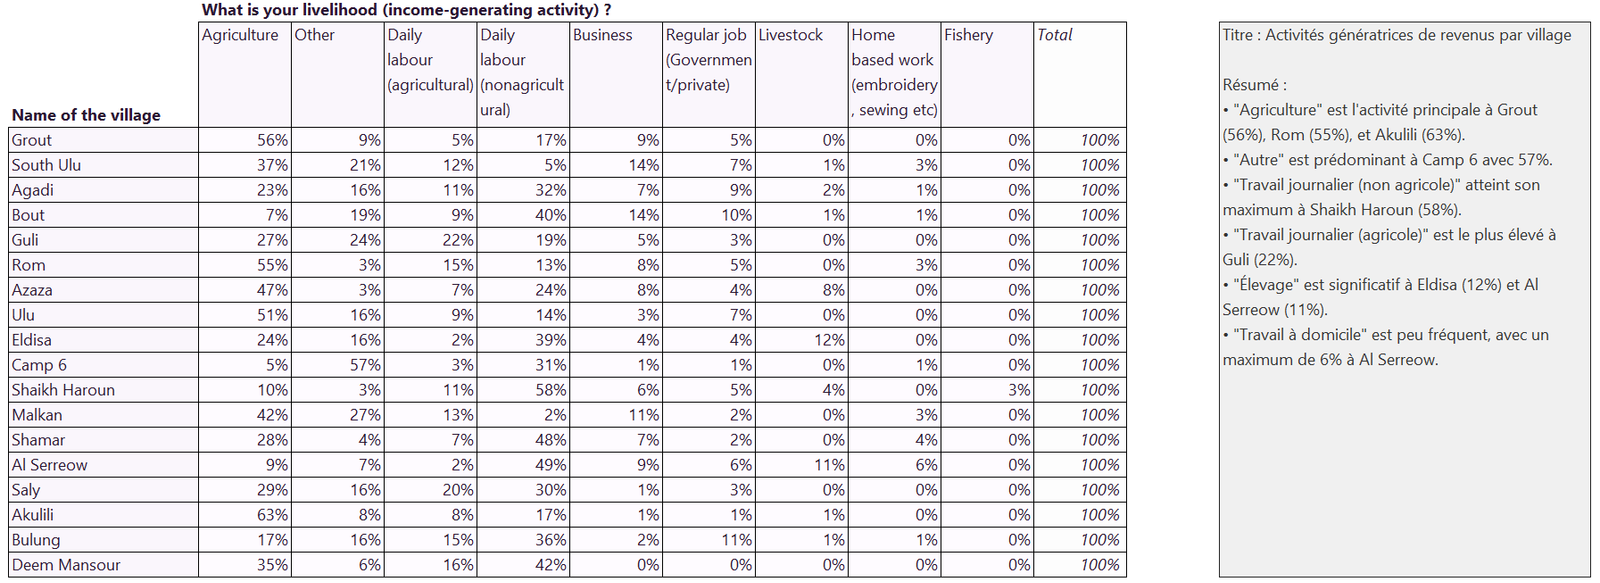
- One interpretation per table: a short summary of the main findings.
- A synthesis for each series of tables, highlighting red flags.
- A narrative report in Word format, bringing together the detailed analysis and a conclusion.
- Cleaning of hand-typed answers, such as "Other, specify", to make them usable.
Every text produced is there to be reviewed: it offers a first reading, which the analyst enriches with what only the field knows. The add-in is available in about ten interface languages.
Your data, plainly
For sensitive data, the add-in offers two options.
| Option | Where the data is processed | What for |
|---|---|---|
| On-device AI | On your computer. A local service, installed with the add-in, hosts the model: no data leaves the machine. | Organisations whose policy forbids sending any data to an online service, even encrypted. |
| OptIA | On infrastructure dedicated to Opti', with no third-party AI provider. Requests are processed in memory and purged after each analysis. | Sensitive data, with the power of a hosted model. Included in the Pro plan. |
On-device AI is installed with a Windows installer, with several model sizes depending on the machine's power. The principles behind these choices are set out in the TRUST framework.
Use cases
- Analysing a field survey dataset.
- Understanding or cleaning a dataset received from a partner.
- Producing the results tables of a donor report.
- Comparing disaggregated results between groups.
- Preparing the analysis section of an evaluation report, or a feedback session.
Video tutorial
A full analysis, step by step (in French).
Frequently asked questions
Is the Excel add-in included in my Opti' plan?
Yes. The Excel add-in is included in all four Opti' plans, including the free Demo plan. OptIA, the hosted private AI, is reserved for the Pro plan.
How do I install the add-in?
From Excel, through the Insert menu then Office Add-ins, by searching for Opti'. Or directly from the add-in's page on Microsoft AppSource. It then appears in the Excel ribbon.
Can my data stay on my computer?
Yes, with the on-device AI option. A service installed with the add-in hosts the model on your machine and answers requests without any data leaving the computer. It is installed with a Windows installer, with several model sizes depending on the machine's power.
Do I also need to use Opti's web platform?
No. The add-in analyses any dataset open in Excel, whether it comes from KoboToolbox, ODK, Opti' or a partner. The web platform also covers the rest of an M&E assignment, from terms of reference to the final report: see Opti Gemba.